Loading Ephys Data (AP and LFP band)
Electrophysiology features computed on AP and LFP band of raw ephys data
Relevant Alf objects
ephysTimeRmsAP
ephysSpectralDensityAP
ephysTimeRmsLF
ephysSpectralDensityLF
Loading
Loading RMS
[2]:
from one.api import ONE
one = ONE()
pid = 'da8dfec1-d265-44e8-84ce-6ae9c109b8bd'
eid, name = one.pid2eid(pid)

ap_rms = one.load_object(eid, f'ephysTimeRmsAP', collection=f'raw_ephys_data/{name}')
/home/runner/Downloads/ONE/openalyx.internationalbrainlab.org/hoferlab/Subjects/SWC_043/2020-09-21/001/raw_ephys_data/probe00/#2021-12-10#/_iblqc_ephysTimeRmsAP.rms.npy: 100%|██████████| 3.12M/3.12M [00:00<00:00, 7.27MB/s]
/home/runner/Downloads/ONE/openalyx.internationalbrainlab.org/hoferlab/Subjects/SWC_043/2020-09-21/001/raw_ephys_data/probe00/#2021-12-10#/_iblqc_ephysTimeRmsAP.timestamps.npy: 100%|██████████| 8.25k/8.25k [00:00<00:00, 67.4kB/s]
Loading Spectral Density
[3]:
lf_psd = one.load_object(eid, f'ephysSpectralDensityLF', collection=f'raw_ephys_data/{name}')
/home/runner/Downloads/ONE/openalyx.internationalbrainlab.org/hoferlab/Subjects/SWC_043/2020-09-21/001/raw_ephys_data/probe00/_iblqc_ephysSpectralDensityLF.power.npy: 100%|██████████| 790k/790k [00:00<00:00, 2.28MB/s]
/home/runner/Downloads/ONE/openalyx.internationalbrainlab.org/hoferlab/Subjects/SWC_043/2020-09-21/001/raw_ephys_data/probe00/_iblqc_ephysSpectralDensityLF.freqs.npy: 100%|██████████| 2.18k/2.18k [00:00<00:00, 15.2kB/s]
More Details
Useful modules
Exploring Ephys Data
Example 1: Removing non electophysiological channels
[4]:
# The objects ephysTimeRms and ephysSpectralDensity contain data for all channels on the probe including the channel used
# for syncing

# The indices of the ephys channels can be found using the following
from neuropixel import trace_header
inds = trace_header()['ind']

lf_psd['power'] = lf_psd['power'][:, inds]
Example 2: Find low frequency PSD of LFP signal
[5]:
import numpy as np

# Define frequency range of interest 8-20 Hz
freq_range = [8, 20]

freq_idx = np.bitwise_and(lf_psd['freqs'] >= freq_range[0], lf_psd['freqs'] <= freq_range[1])

lfp_dB = 10 * np.log(lf_psd['power'][freq_idx, :])
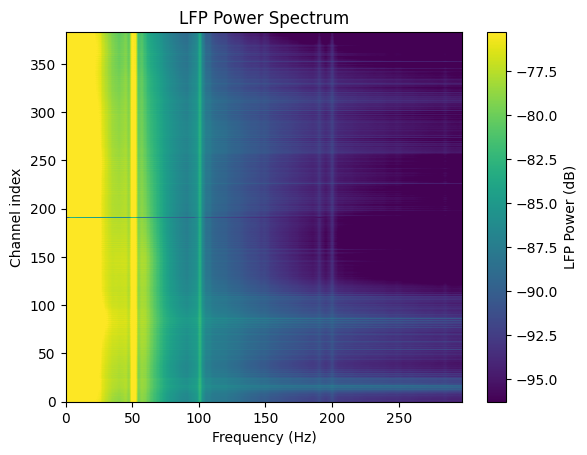
Example 3: Plot LFP PSD spectrum
[6]:
from brainbox.ephys_plots import image_lfp_spectrum_plot

data, fig, ax = image_lfp_spectrum_plot(lf_psd['power'], lf_psd['freqs'], display=True)
Other relevant examples
COMING SOON